High-Performance Biofiltration: Where Sand Filters Have Gone |
||||||||||||||||||||||||||||
by David Venhuizen, P.E. |
||||||||||||||||||||||||||||
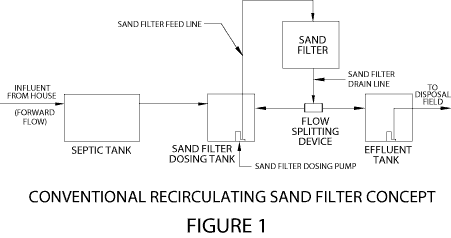
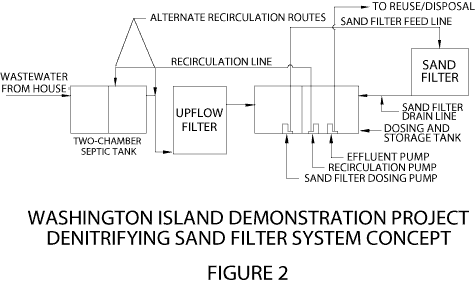
INTRODUCTIONThe high-performance biofiltration concept is the evolutionary end product of intermittent sand filter technology. As the U.S. EPA document Technology Assessment of Intermittent Sand Filters states: "Intermittent sand filtration of wastewater is not a new technology." (Anderson, et al, 1985) It has been reported that various forms of sand filtration have been used to purify water for centuries. (Montiel, et al, 1988) The modern concept of intermittent sand filtration derived from observations made in the mid-1800's at "sewage farms" in sandy soils. The drainage from these areas, onto which wastewater was intermittently dosed, was greatly purified. This led to using sand beds especially constructed for wastewater treatment. (Dymond, 1981) Over the last 100+ years, a vast amount of information on intermittent sand filter technology has been produced. In the last three decades, this process has been studied and used for addressing the problems of small-scale wastewater management. These experiences have shown that, again quoting the U. S. EPA’s Technology Assessment: “Intermittent sand filters are … ideally suited to rural communities, small clusters of homes, individual residences and business establishments. They can achieve advanced secondary or even tertiary levels of treatment consistently with a minimum of attention.” (Anderson, et al, 1985) This paper reviews the background of this technology, with emphasis on the development of “advanced” design concepts from which the high-performance biofiltration concept has grown. First, a discussion of the advantages of the biofiltration process is offered. This is followed by a historical review of basic process development. Next refinements added in recent years, most particularly the denitrification concept, are presented. Then the high-performance biofiltration concept which has evolved from all these developments is detailed, followed by a general discussion of maintenance requirements. A review of this paper will provide the regulator with sufficient knowledge to judge applications of this technology presented for review, will provide the designer with the basic knowledge required to design a high-performance biofiltration system, and will provide the installer with detailed insight into how the system can be constructed. ADVANTAGES OF BIOFILTRATION AS A TREATMENT METHODIt is precisely because, as the quote from EPA’s Technology Assessment points out, sand filters operate reliably in such a trouble-free manner that this technology is especially well-suited for small-scale wastewater systems. The basic technology is very “fail-safe” in that it is inherently stable. Generic classification of this technology is “attached growth aerobic process” and the intermittent sand filter is a very lightly loaded version of that process. Thus, mean cell residence time is very long, which imparts stability. Also, the biology of the system is quite diverse, typically including many trophic levels of microorganisms, and some macroorganisms as well. (Calaway, et al, 1952, Calaway, 1957) These characteristics render the process inherently resistent to upsets, and also allow it to readily accommodate situations where system loading is highly non-uniform. The major failure mode of the biofiltration process is clogging of the filter bed. When clogging becomes severe, it forms a barrier to passage of wastewater through the filter. Thus, the consequence of failure is that water backs up in the system, which should force attention to the problem. Even when clogging of sand filters has proceeded to the point where water is continuously ponded on the bed surface between doses—a condition of extreme neglect of proper maintenance—the effluent quality typically does not degrade significantly. Once the filter bed has been rehabilitated, which can be done quickly and expeditiously in a well-designed system, the process is immediately back in full working order. In any case, clogging is a problem that builds up slowly over a period of years. (Anderson, et al, 1985) Incipient failure can be readily recognized by an operator and maintenance can be executed essentially at his leisure. This is in stark contrast to activated sludge, which is the technology most often employed for small-scale wastewater systems. Treatment in that process is affected by few trophic levels of aerobic organisms suspended in the liquid mass and living in concentrations far in excess of those found anywhere in nature, requiring active aeration in order to remain viable. The environment of that liquid mass must be rather tightly controlled, which typically dictates that sludge must be withdrawn from the system on a time scale measured in hours, or else the process may be upset. Because of these characteristics, the process is inherently unstable, requiring constant inputs of energy and close attention to maintaining proper operating parameters in an effort to keep the process on track. Further, the activated sludge process does not readily accommodate non-uniform loading—indeed there is not even an accepted operating theory for activated sludge processes other than those based on steady-state flow. Because the process provides no physical barrier to passage of water through it, the consequence of an upset can be passage of poorly treated effluent in fairly short order. Once the activated sludge process goes “off track” it often takes considerable time for it to recover. These contrasting characteristics dictate that biofiltration technology is far better suited for use in small-scale systems, where continuous attention to the treatment process is typically not affordable. To enhance the cost efficiency of biofiltration technology—and thus promote its broader use—“advanced” design concepts which render the process more efficient, and even more highly reliable than the “basic” concept, can be employed. The derivation and exhibition of those concepts is the subject of this paper. HISTORICAL DEVELOPMENTThe idea of a sand filter bed for wastewater treatment derived, as has been noted, from observing conditions at “sewage farms” in sandy soils. In those operations, the sewage was “flood-dosed” onto the fields. Thus it is not surprising that the initial design concept for the sand filter treatment process used fairly fine sand and entailed flooding the filter with the entire daily loading all at one time. This allowed a full day for the wastewater to infiltrate and pass through the filter bed. In one of the earliest recorded efforts to systematically study this process, these operating parameters were fairly well standardized, as was filter bed depth, at four feet. The major process innovation of this era was a “formal” underdrain system that promoted complete drainage of the filter bed. Loading rates onto filter beds designed and operated in this manner were typically limited to about 1-2 gal/ft2/day (4-8 cm/day) to avoid frequent clogging of the bed. The slow infiltration rate allowed by the fine sand bed resulted in clogging being largely a surface phenomenon, so periodic raking or tilling of the bed to break up the “cake” that formed on the surface along with occasional removal (scraping) of the surface layer became the standard maintenance protocol. (Clark & Gage, 1909) It appears that this design concept remained the “standard” for decades. These arrangements required that a plant of any size would entail a very large bed area. Not only was this land intensive—and thus relatively expensive—but the hydraulics of influent distribution and effluent collection could be problematic, and maintenance of such large bed areas was cumbersome. It is not surprising then that sand filtration technology fell by the wayside as a “mainstream” treatment method when activated sludge and trickling filter technology proliferated. By the 1940’s, sand filter treatment plants had become rare. Still, it was recognized that the simplicity and high reliability of sand filtration technology made it a very good choice for smaller treatment plants. Recognizing the need to more fully explore the capabilities of this technology and so promote its use, an intensive study of sand filtration was conducted at the University of Florida in 1940’s and 50’s. These studies showed that sand filters could be loaded more heavily when appropriate design and operating parameters where employed, thus considerably reducing required bed size. A major observation in the Florida studies was the impact of loading frequency. It was found that, all other factors remaining equal, splitting the daily load into two doses increased removal efficiencies and allowed sands of a given size to be loaded more heavily. (Grantham, et al, 1949). This led to further investigations of more frequent loadings. The conclusion of these studies was that more frequent loadings can allow higher loading rates to be readily accommodated with no degradation in treatment and without premature clogging of the filter. (Furman, et al, 1955) Another major observation was the effect of media size on allowable loading rate, and the interaction of this parameter with loading frequency. For filters employing larger media, treatment performance was observed to improve with more frequent loadings, even when higher hydraulic loading rates were applied. A filter with an effective sand size of 1.04 mm—somewhat larger than the 0.2 to 0.4 mm effective size typically employed in sand filters to that point—demonstrated a 96% BOD5 removal efficiency when loaded once per hour at a rate of 13.8 gal/ft2/day (55.2 cm/day), a huge increase over the rates typically employed. This contrasted with a removal efficiency of only 70-80% at loading rates ranging from 4.02 to 9.76 gal/ft2/day (16.1-39.0 cm/day) when the filter bed was only loaded twice per day. Two other filters with smaller sands—0.44 mm and 0.46 mm effective size—had BOD5 removal efficiencies ranging from 80% to 93% when loaded twice per day at hydraulic loading rates ranging from 2.87 to 7.46 gal/ft2/day (11.5-29.8 cm/day). When loading frequency on these filters was increased to 4 times per day at a hydraulic loading rate of 6.89 gal/ft2/day (27.5 cm/day), removal efficiencies elevated to 95-97%. (Furman, et al, 1955) Another significant observation in the Florida studies is the impact of loading frequency and media size on allowable organic loading rate. Some references state that to preclude premature clogging, it is expected that organic loading rates should be limited to less than 0.005 lb BOD5/ft2/day. (Anderson, et al, 1985) In most of the trials quoted above, however, organic loading rates ran somewhat in excess of this “limit”. It was stated in early studies of the intermittent sand filter that “… the volume of sewage that can be purified … is dependent upon the amount of organic matter present in the wastewater rather than the volume of wastewater in which this organic material is held.” (Anderson, et al, 1985) More simply put: “Allowable [hydraulic] loading rates increase with the degree of pretreatment. A strict relationship establishing an organic loading rate … has not yet been clearly defined in the literature.” (U.S. EPA, 1980) The Florida studies indicated that allowable organic loading rate would be sensitive to various design parameters. This information appears to have lain fallow for many years before interest was reawakened when sand filters began to be used for individual home (“on-site”) wastewater systems. Mitchell (1986) demonstrated the ability of sand filters to accommodate elevated loading rates when the influent is septic tank effluent that has been pretreated by passing through an anaerobic upflow filter. Four sand filters, each containing media of 0.52 mm effective size, were loaded at rates of 1.5, 3, 9 and 15 gal/ft2/day (6, 12, 36, 60 cm/day). Loading frequency was not reported. Filter influent averaged 85 mg/l of BOD5, and the effluent from all four filters was below 5 mg/l throughout the 6-month study period, a removal rate of over 94%. At 15 gal/ft2/day (60 cm/day), organic loading rate was 0.011 lb BOD5/ft2/day. While influent levels were not reported, TSS concentrations in the effluents were less than 3 mg/l throughout the study period. Mitchell reported that there was no evidence of clogging in any of the filters. He offered the opinion that such a system could operate indefinitely without needing filter bed maintenance at 8 gal/ft2/day (32 cm/day), and could probably do so at rates in excess of 15 gal/ft2/day (60 cm/day). (Mitchell, 1987) Swanson and Dix (1987) studied a recirculating filter treating household septic tank effluent that had been pretreated by passage through a rock filter. Several operating periods were reported, with forward flow loading rates ranging from 3.0 to 8.2 gal/ft2/day (12-32.8 cm/day) and total hydraulic loading rates (forward flow plus recirculation flow) ranging from 13.8 to 44.8 gal/ft2/day (55.2-179.2 cm/day). Except for the trials run at 3.0 gal/ft2/day (12 cm/day), organic loading rates were in excess of 0.005 lb BOD5/ft2/day. Over the 8-month study period, effluent BOD5 averaged 3.4-12.1 mg/l, representing removal efficiencies of 91-98%. Though not statistically significant, it is interesting to note that the lowest efficiency was achieved at the lowest forward flow and total hydraulic loading rate, and the highest efficiency was experienced at the highest forward flow and second-highest total hydraulic loading rate. For TSS, the overall average effluent strength was 7.7 mg/l, representing a 90% removal efficiency. The range of TSS removal efficiency was 84% to 93%, with the highest efficiencies again being observed at the highest loading rates. Venhuizen, et al (1998) reported on two years of observations on the performance of five recirculating sand filter systems under “field” conditions in a demonstration project on Washington Island, Wisconsin. Four of the systems served residences and one served the island’s grocery store. Reflecting the “real world” setting, the circumstances of each system varied, and the usage of some of the systems varied with the seasons. In general, however, removal rates for BOD5 and TSS were in excess of 95% at forward flow hydraulic loading rates ranging from 2.5 to over 10 gal/ft2/day (10-40 cm/day). Septic tank effluent strengths were typically quite high, especially at the store (averaging in excess of 1,000 mg/l in the summer with a 749 mg/l overall average for the observation period) where the relatively low 2.5 gal/ft2/day (10 cm/day) forward flow loading rate was observed, so average organic loading rates were well above 0.005 lb BOD5/ft2/day in all the systems. The latter two experiences introduce the recirculation concept. Introduced by Hines and Favreau, recirculation was initially used to minimize odors when dosing open sand filters with septic tank effluent. (Hines & Favreau, 1975, Teske, 1979) It was immediately observed that recirculation also improved treatment efficiency. This is due in part to the more uniform loading schedule that recirculation can impart. The major factor, however, is dilution of the filter influent strength imparted by mixing forward flow with recirculation flow. For example, in the observations reported by Swanson and Dix and by Venhuizen, average organic loading rate was high, but with recirculation ratios ranging up to 7:1, the organic strength of the applied influent was greatly reduced. The benefits of this, in particular with regard to enhancing nitrification through a sand filter bed, are detailed by Piluk (1988). One of the systems in the Washington Island project provided a graphic example of the benefits of recirculation. The filter was operated in a single-pass mode for almost a year. During this period, BOD5 removal averaged only 78.6% (60.2 mgl/l average strength), TSS removal averaged 80.9%, and nitrification was inconsistent. Within two weeks after a recirculation system was installed, high degrees of BOD5/TSS removal and nitrification were achieved, despite this system being quite heavily loaded—averaging greater than 8 gal/ft2/day (32 cm/day) forward flow—for the three months following startup of the recirculation system. The system operated with this improved efficiency until the end of the observation period over a year later. BOD5 removal average 94% (12.4 mg/l average strength), even though there was a flaw in the recirculation system that caused the recirculation ratio to vary widely. This improvement was due to all the factors reviewed above—more frequent dosing, more uniform loading cycle, and decreased organic strength of the applied influent. (Venhuizen, 1994) The Washington Island project also confirmed the observations of the Florida studies (and many other efforts over the last two decades—e.g., Swanson & Dix, 1987, Sandy, 1987, Piluk, 1988) that treatment efficiency can be maintained when employing coarser media if loading is frequent and uniform over the diurnal cycle. Three of these systems employed a very coarse gravel media in the size range of 1/4”—3/8” (6—9.5 mm) yet still provided superior performance. When using coarse media, it becomes critically important to load the biofilter as uniformly as practical over its entire surface. While fine media filters present sufficient resistance to infiltration that a rapidly loaded dose would spread over the bed surface even if loaded at a single point, coarse media filters will cause no such spread from the point of application, at least not until significant clogging had developed at that point. When that occurs, then adjacent areas would receive all the flow until they too clogged, and so on, until this “progressive failure” resulted in the whole bed becoming clogged. While many practitioners employ perforated headers to distribute influent, a practical header system would only provide a more “fine-grained” array of point loadings, still wasting a significant portion of the bed surface. Maximum efficiency is achieved by a spray distribution system. The partial aeration of the wastewater imparted by spray distribution is also beneficial to the treatment process, as detailed by Piluk (1988). Another basic design parameter is media depth. Design criteria generally recommend a filter bed depth of 24-36 inches (61-91 cm) when using a porous media. The Florida studies showed that most of the purification is affected within the top 9-12 inches (23-30 cm) of the media. (Furman, et al, 1955, Calaway, et al, 1952) It is asserted that additional media depth imparts consistency, assuring a more uniform effluent quality. (Anderson, et al, 1985, U.S. EPA, 1980) However, the reasons given for this are that deeper beds are not as severely affected by rainfall and that they permit scraping off of more media before replacement becomes necessary. A coarse media filter is not cleaned by scraping, and the high-performance biofiltration concept employs covered filter beds, so it is likely that less than 24 inches (61 cm) of media depth would be sufficient to assure good performance. It is to be expected, however, that using coarser media urges greater media depth, and 24 inches (61 cm) is typically recommended. More recent work by Tchobanoglous (1999) indicates that not only is strength of the applied influent important, but reducing particle size in the wastewater can have a dramatic impact on treatment efficiency. Tchobanoglous asserts that this is because smaller particles are more quickly digested by the biota of the filter bed, in essence more quickly “freeing up” those microbes to digest particles carried into the filter by the next dose. This factor urges the use of prefiltration devices that exclude large particles in the high-performance biofiltration process. DESIGN FOR NITROGEN REMOVALIt turns out that design features that would enhance biofilter treatment efficiency in regard to BOD5 and TSS removal and would allow it to be more heavily loaded also generally promote a high degree of nitrification—the conversion of ammonium-nitrogen in the wastewater to the nitrate form. This is a prerequisite for eliminating nitrogen from the wastewater by denitrification—the conversion of nitrate to nitrogen gas, which bubbles off into the atmosphere. A number of works have explored the use of modified recirculating biofilter concepts to effect removal of nitrogen from wastewater by clever manipulation of the nitrogen cycle. Denitrification requires an anaerobic environment and an adequate food source for the denitrifiers. Nitrified biofilter effluent is routed through the anaerobic “front end” of the system, where these conditions are met, and denitrification occurs as the recirculated water flows through it. It had been observed that some degree of denitrification occurs in the conventional recirculating biofilter process—illustrated in Figure 1—when recirculated effluent mixes with septic tank effluent in the dosing tank. (Piluk, 1988) Modifications of that process aim to provide a better anoxic environment to increase the degree of denitrification. Piluk (1988) and Sandy (1987) reported on studies employing “batch” concepts in which a horizontal flow rock bed underlying the filter bed served as an anoxic reactor. Septic tank effluent was routed through this rock bed, where it mixed with effluent flowing out the bottom of the filter bed. Organic carbon in the septic tank effluent provided the energy and nitrate in the biofilter effluent provided the substrate for denitrifying bacteria. Reductions in total nitrogen (TN) on the order of 70% were observed in these studies. The disadvantage of this configuration is that overall system effluent is a mixture of denitrified biofilter effluent and septic tank effluent that had only traversed the rock bed, somewhat defeating the purpose of investing in the high quality treatment capabilities of a biofilter. Hydraulic residence time (HRT) in the rock beds of these systems was quite high, on the order of 3 days, which the investigators expected would be required to achieve high rates of denitrification. Mitchell, however, demonstrated 70-75% total nitrogen removal using a system with an anaerobic upflow filter (vertical flow rock bed anoxic reactor) and a biofilter in sequence, employing relatively low HRT’s—8 to 16 hours—in the upflow filter. (Mitchell, 1991) This was a primary basis for the system concept, illustrated in Figure 2, which Venhuizen designed for the Washington Island systems. Results from that project indicated that 60-90% reduction in TN concentration could be consistently obtained. Average influent TKN (organic plus ammonium nitrogen) ranged from 37.9 mg/l in one of the residential systems to 130 mg/l in the grocery store system. Removal percentage typically increased with higher influent nitrogen content. Effluent TN concentrations generally less than 15 mg/l were observed in all of the Washington Island systems when proper operating conditions were maintained. (Venhuizen, 1994)
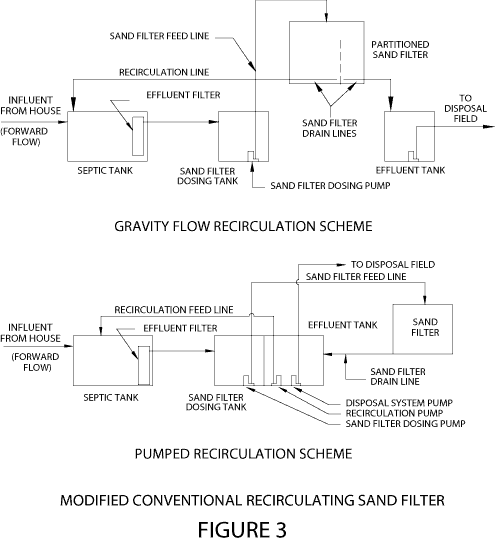
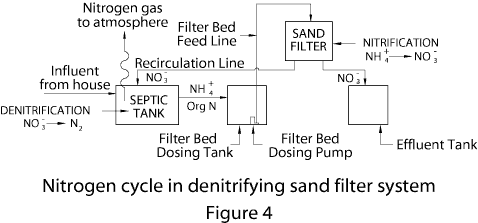
It was observed in the Washington Island systems that when biofilter effluent was recirculated back into the septic tank rather than directly into the upflow filter, most of the nitrate was denitrified in the septic tank. This occurred even though recirculation flowed only through the second chambers of two-chamber septic tanks in which the HRT’s were fairly low. (Venhuizen, 1994) Concurrent work by Piluk in Anne Arundel County, Maryland, also confirmed that, given proper system design, little loss of nitrogen removal efficiency would result from elimination of the upflow filter. (Piluk & Peters, 1994) Results from monitoring of three systems yielded an average of 64% TN reduction, with effluent TN concentrations averaging 20 mg/l. This configuration is a “modified conventional” recirculating biofilter concept, illustrated in Figure 3. The nitrogen cycle in this denitrifying concept is illustrated in Figure 4.
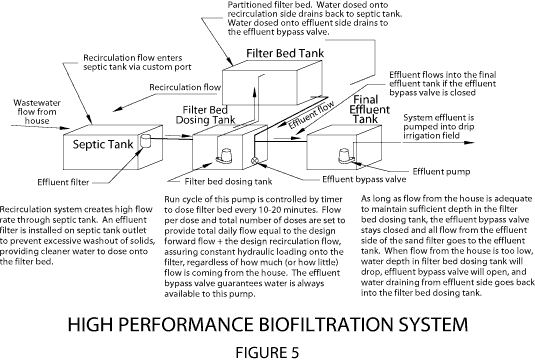
OPTIMIZING THE RECIRCULATION SYSTEMMost biofilter systems employ various schemes to split the filter bed effluent stream by gravity, routing part of it to the recirculation loop and part of it the dispersal field, as shown on the top of Figure 3. As usually practiced, however, this method imposes a major design compromise. This gravity flow recirculation concept can only provide recirculation flow when the filter bed is dosed, since there is no flow out of the bed otherwise. The filter bed dosing pump could be controlled by float switches to provide a dose whenever a given volume builds up in the dosing chamber. Wastewater flow is typically highly non-uniform through the diurnal cycle, and flow peaking typically becomes more pronounced as system size gets smaller. Volumetric dosing would therefore result in very non-uniform loading of the filter bed. This violates one of the principles of high-performance biofiltration, as experience indicates this is detrimental to system performance. Since recirculation flow occurs only in response to forward flow, there would be less recirculation flow when forward flow is low, and this would result in lower denitrification potential as well. System designers have attempted to get around these problems by controlling the filter bed dosing pump with a timer. A large dosing chamber provides for flow equalization. Water level builds up during forward flow peaks and is drawn down during periods of low or no flow. This scheme is also flawed, as it requires that actual daily flow be accurately estimated. If the daily flow is underestimated, the dosing chamber would fill up, exhausting the equalization volume and tripping the high water alarm. The system should be designed with sufficient equalization volume to essentially eliminate such “false alarms” during normal system operation. If the flow is overestimated, there would be periods when the dosing chamber is empty. To protect the pump, it would need to be locked out when water level became too low, so there would be times when scheduled filter doses would be skipped, resulting again in non-uniform dosing of the filter bed. Since statutory design flow rates are often somewhat in excess of actual flows, this problem is likely to be ubiquitous. While this scheme would flatten and spread the flow peaks out over time, these “gaps” in the dosing cycle would again be detrimental to denitrification. In any case, neither volumetric dosing nor this timed dosing scheme can keep the system active during a prolonged period of no forward flow—e.g., when residents of a house are on vacation—since lack of forward flow results in no dosing of the filter bed in either case. This would impose a “restart” period of degraded performance on the system when forward flow resumes. The pumped recirculation scheme illustrated in Figure 3 was implemented to solve these problems. The effluent pump control system—usually “on” and “off” float switches—is arranged so that a minimum “permanent” liquid depth remains below the “off” level, providing a sump for the recirculation pump. Because recirculated flow loops through the system and returns to the effluent tank, this sump is replenished even when there is no forward flow through the system. It was realized, however, that there are flaws in this scheme as well. The recirculation pump is controlled by a timer. This dictates that the total daily recirculation flow would be constant, so that recirculation ratio would vary with actual daily forward flow. The dosing pump is controlled by float switches to deliver a fixed volume per dose. Since low forward flow decreases total flow through the system, fewer doses would occur, so the dosing pattern would not be completely uniform. While that is a fairly minor performance compromise, a recirculation pump failure would cripple the system. In one of the Washington Island systems, a recirculation pump failure went unnoticed for a month and a half even in a system that was being monitored twice weekly. These liabilities can be circumvented by adding a simple component to the gravity recirculation system which optimizes performance while eliminating the liability of another pump. An “effluent bypass valve” is placed in the effluent line from the side of the filter bed which flows to the dispersal field, as illustrated in Figure 5. This valve is set so that if the dosing chamber water level drops to a specified minimum depth, the valve opens so that this flow returns to the dosing chamber instead of flowing to the dispersal system. Thus, when forward flow was insufficient to keep water level in the dosing chamber above the point where this valve opens, there would be two recirculation loops. One is the normal recirculation loop from the “recirculation side” of the filter bed through the septic tank. The other is from the “effluent side” of the filter bed into the dosing tank through the effluent bypass valve. Therefore, all of the water dosed onto the filter bed would return to the dosing chamber, so it could never run out of water even during extended periods of no forward flow, and no filter bed doses would be skipped.
Using this scheme, the filter bed is loaded with the same total volume of wastewater on the same schedule every day, regardless of forward flow rate. Only the organic strength of wastewater in the dosing chamber will vary, depending on the total volume of forward flow, and of course on variations in organic strength of the raw influent to the system. However, volume of the dosing chamber must be a large fraction of the daily design flow rate to prevent “false alarms” so organic strength would not vary widely through the diurnal cycle. The biofilter would operate in “steady state” mode with perfectly uniform distribution of the hydraulic load and nearly uniform organic loading. SYSTEM DESIGN DETAILSA high-performance biofiltration system incorporates all the design parameters reviewed in the foregoing to optimize system performance as much as practical subject to assuring highly reliable operation. As Figure 5 implies, a “standardized” system design can be specified to provide universal design guidance. This section delineates that design concept. Pretreatment UnitsIn the foregoing, the benefits of enhanced pretreatment were reviewed. Therefore, pretreatment prior to application onto the biofilter bed in a high-performance biofilter includes not only settling of gross solids—e.g., septic tank, imhoff tank, or similar primary clarification device—but also provisions for “screening” the wastewater to reduce total solids content and particle size of those solids. As shown in Figure 5, the first stage of this screening is accomplished by an effluent filter on the outlet of the pretreatment tank. These devices prevent passage of particles larger than a given size out of the tank. The two largest manufacturers of effluent filters are Zabel Industries and Orenco Systems, Inc. Zabel claims a particle size limitation of 1/16 inch (1.6 mm) for its A-100 model, which is recommended for use in the high-performance biofiltration concept. Orenco claims a particle size limitation of 1/8 inch (3.2 mm) for its Biotube model, which would be recommended for use in the high-performance biofiltration concept. It is commonly accepted that adequate settling out of solids in a septic tank is dependent upon maintaining a given HRT. (U.S. EPA, 1980) The minimum HRT typically recommended decreases with increasing flow rate. When employing the denitrifying concept, HRT in the pretreatment vessel should be increased above that typically recommended solely for primary clarification. This is required both to assure adequate contact time for complete denitrification and because of the higher flow rate through the pretreatment tank due to the recirculation flow. Typical design criteria suggest that minimum HRT be about 3 days for design flow rates of 300 gallons/day (1135 liters/day), decreasing to less than one day for design flow rates above 1,000 gallons/day (3785 liters/day). For the high-performance biofiltration system incorporating the denitrifying concept, two situations are considered. One is where recirculation flows through a single-chamber pretreatment tank, and the other is where recirculation flows through a secondary chamber following a primary chamber through which only the forward flow is routed. The recommended HRT’s for these situations found in one design guidance manual are shown in the table below (State of Wisconsin, 1999).
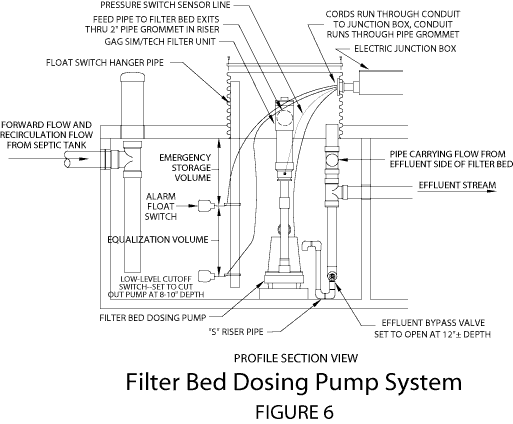
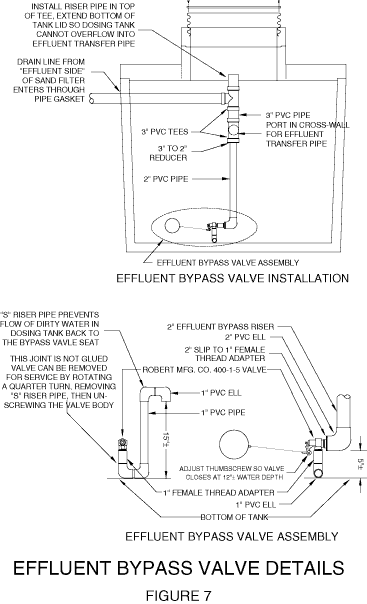
To reduce particle size, a further level of pre-screening prior to application onto the filter is recommended in the high-performance biofiltration concept. This can be expeditiously accomplished by employing in-line screening devices installed in the discharge line of the filter bed dosing pump. Devices that have been found to be effective while requiring infrequent maintenance are the GAG Sim/Tech filter, illustrated in Figure 6, and “Y-strainers” that are often used to screen irrigation water. Filter Bed Dosing SystemThe filter bed dosing system design is illustrated in Figure 6. It consists of the filter bed dosing pump, the in-line filtration device, the pump control system, and the effluent bypass valve assembly. One device that has been used as an effluent bypass valve is detailed in Figure 7.
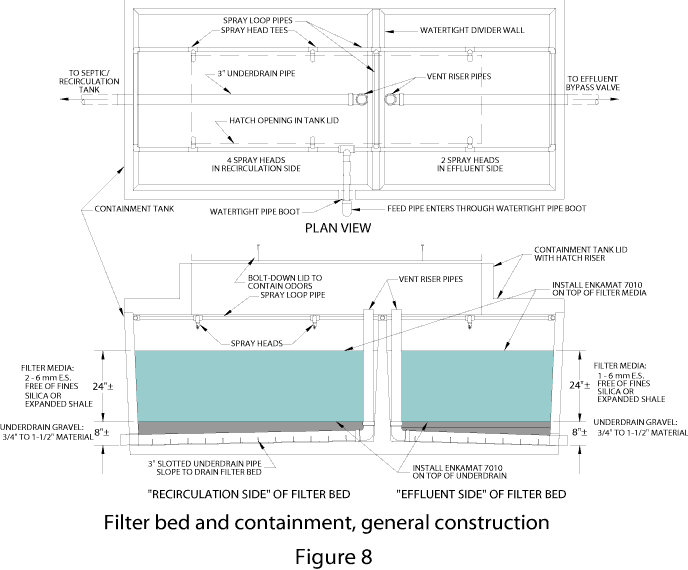
The filter bed dosing pump is controlled by a repeat cycle timer to deliver a dose of pre-determined volume to the filter at set intervals. It has been shown that, when all other aspects of system design are in conformance with the high-performance biofiltration concept, performance is improved as dosing intervals become shorter. (Tchobanoglous, 1999) There is a practical limit, however, as the feed piping distributing flow onto the filter would drain between doses and would need to be refilled by the next dose before dosing of the filter actually begins. Also, an excessive number of pump starts per hour would decrease pump service life. Based upon results to date, it is expected that dosing intervals in the range of 15 minutes would optimize performance within practical limits. (Ruppe, 2000) Design recirculation ratio is standardized at 2:1, as detailed below in the discussion of biofiltration bed design. However, the recirculation rate—the ratio of total flow onto the filter bed to forward flow—can be varied upward from there. As explained previously, when forward flow is low, the filter bed dosing chamber water level would be drawn down, and when it gets low enough, the effluent bypass valve will open to prevent the dosing chamber from running out of water. If the recirculation rate is higher than 3:1 (which matches the 2:1 recirculation ratio), this would cause the effluent bypass valve to open and close at least once every day even when the full design flow rate is being routed through the system. This is considered desirable to further dilute the strength of wastewater applied to the filter bed, and to help maintain certain types of effluent bypass valve devices in good working order. The instantaneous flow rate produced by the pump is determined by characteristics of the filter bed feed system. The pump is chosen to produce sufficient flow to service the distribution system being used. As noted below in the discussion of biofiltration bed design, spray heads are typically used in the high-performance biofiltration concept. The pressure recommended to drive the spray head is obtained from the manufacturer, or from actual testing to achieve a desired spray pattern. This pressure plus friction losses in the feed piping and the elevation head between the dosing chamber water level and the filter bed spray loop determine head requirements of the pump. Because the losses in the feed and distribution system can vary, it is recommended that actual flow out of the spray heads be observed in the constructed system before setting up the dosing cycle. Once the dosing interval and design recirculation rate are chosen, and the actual flow out of filter bed spray heads are measured, the dosing cycle can be established. The following provides an example of these calculations: Design flow rate = 300 gallons/day (1135 liters/day) Design recirculation rate = 3.5 Total daily flow onto filter bed = 3.5 x 300 = 1,050 gallons (3974 liters) Dosing interval = 15 minutes è 1440/15 = 96 doses/day Volume per dose 1050/96 = 10.9 gallons/dose (41.4 liters/dose) Measured instantaneous flow rate to filter bed 32 gallons/min (121 liters/min) Dose time = 10.9/32 = 0.34 minutes = 20.5 seconds To the dose time calculated in this manner must be added the time it takes to fill up the feed piping till water actually begins to flow onto the filter bed. Repeat cycle timers typically are set with an “off” time and an “on” time. Assuming that it takes 7.5 seconds to fill the feed piping, in this example the “on” time would be 20.5 + 7.5 = 28 seconds and the “off” time would be 15 minutes minus 28 seconds, or 14 minutes, 32 seconds. Most practical timers cannot be set with such accuracy, so that the actual dosing cycle is typically a close approximation of the calculated values. As long as the effluent bypass valve works properly, the level at which it opens defines the bottom of the equalization volume. The level at which the high water alarm sounds defines the top of the equalization volume. The amount of equalization volume should be sufficient to preclude frequent “false alarms” which occur when water level rises to the alarm level during a surge of flow to the system but the pump is working properly. Minimum equalization volume required is a matter of experience, considering the inflow characteristics of the system at hand. For typical domestic wastewater systems, one guidance document suggests equalization volumes that vary from 0.75 times design flow rate for a design flow rate of 300 gallons/day (1135 liters/day) to 0.45 times design flow rate for flows over 1,500 gallons/day (5678 liters/day). (State of Wisconsin, 1999) The primary function of the alarm switch is to signal that the dosing pump has failed. As noted previously, it may also signal that excessive flow is being routed to the system, as this would eventually exhaust the equalization volume. This is a desirable feature of the control system, as it can alert the system users to such problems as leaking toilets. (When using duplex pump systems, other types of failure alarm arrangements may be used, but a high water alarm is still incorporated to signal this excessive water use.) To prevent the pump from running dry in case the effluent bypass valve were to stick in the closed position—or some other mishap, such as a broken pipe, prevented filter bed effluent from returning to the dosing chamber—a low-level cutoff switch is installed, as shown on Figure 6. This switch is set to suppress pump operation if water level in the dosing chamber falls more than an inch or so below the level at which the effluent bypass valve should open. If the low-level switch does “make” it should set off an alarm so that it will be known that this condition has occurred. If the problem is a stuck bypass valve, this problem could continue indefinitely without notice otherwise. Biofiltration BedThe heart of the treatment system is the filter bed, illustrated in Figure 8. The balance of the system simply maintains operating conditions of the bed as close to optimal as practical in terms of bed influent characteristics and dose timing. It remains to design the filter bed to take full advantage of those conditions in the most efficient manner practical. Design features are hydraulic loading rate, recirculation ratio, media size, media depth, distribution system, and underdrain system.
Based upon historical observations like those reported in this paper, it is concluded that the high-performance biofiltration concept can be expected to operate indefinitely with very infrequent bed maintenance at hydraulic loading rates of at least 7 gal/ft2/day (28 cm/day). This is recommended as the “basic” design hydraulic loading rate when treating wastewater of typical domestic strength (raw influent BOD5 less than 300 mg/l). Those experiences also indicate that filters loaded in this range should employ larger media. As noted previously, when the high-performance concept loading schedule is assured, using coarser media does not result in significant reduction in treatment performance. The high-performance biofiltration concept employs a split filter bed that separates effluent flow into a recirculation stream and an effluent stream. The recirculation stream flows back through the system; only the effluent stream exits the system. It is clear then that the exact quality level of the recirculation stream is of little consequence. A 30 mg/l BOD5 concentration would serve just as well as a 10 mg/l level. The only real requirement is that a high degree of nitrification be achieved during passage of wastewater through the recirculation side of the filter bed. This circumstance is used to advantage in designing the bed in a more economical manner. Since it does not matter if effluent quality out of the recirculation side of the bed degrades slightly, the design concept “pushes” the hydraulic loading rate on this portion of the filter bed up to 8.5 gal/ft2/day (34 cm/day). At the same time, to enhance quality of effluent out of the effluent side of the filter bed, the hydraulic loading rate on this portion of the bed is reduced to 5.5 gal/ft2/day (22 cm/day). Loading rate on each side of the filter bed should be “de-rated” by approximately the same factor when treating higher strength waste. Experience indicates that a design recirculation ratio in the range of 2:1 will provide good treatment performance. (Venhuizen, 1994) As discussed previously, that sets the minimum recirculation rate at 3:1. This will result in a total hydraulic loading rate of 3 x 8.5 = 25.5 gal/ft2/day (102 cm/day) onto the recirculation side and of 3 x 5.5 = 16.5 gal/ft2/day (66 cm/day) onto the effluent side of the filter bed. These are rather moderate flow rates; the Washington Island systems, for example, have operated well with minimal maintenance requirements at total hydraulic loading rates higher than this. The 2:1 recirculation ratio is enforced by installing twice as many spray heads over the recirculation side as are installed over the effluent side. A further refinement is to use a coarser media on the recirculation side to minimize the likelihood of early clogging at the higher loading rate, and to use a finer media on the effluent side to further enhance effluent quality. Experience to date indicates that these are very marginal advantages, however, so this is typically not entertained unless installing two different media sizes happens to be convenient. Still, one design guidance manual suggests a range of filter media effective size of 2-6 mm for the recirculation side and of 1-2.5 mm for the effluent side. (State of Wisconsin, 1999) A media depth of 24 inches (61 cm) is fairly universally accepted as the design criterion for recirculating filter beds, and it is recommended as the nominal bed depth criterion for the high-performance biofiltration concept. Bulk or bagged rock or sand media may be used. Silica-based materials are typically used, but any material with sufficient hardness and resistance to dissolution may be used, e.g. expanded shale media. More recent investigations have offered the option of using very different types of media in these systems. These are foam and textile media, which can be loaded at somewhat higher rates than porous media, according the claims in the literature. (Jowett, 1997, Roy, et al, 1998) Also fairly recently, granular peat has been tested as a biofiltration media. This media appears able to strip considerable phosphorus out of the wastewater in addition to the normal level of treatment provided by a biofiltration system. (Hagan, 2000) Should these types of media prove to be effective and found to be more cost efficient, the high-performance biofiltration concept will readily accommodate their use. Since the filter bed containment is a separate module, these alternative media could readily be “plugged into” the system and loaded in similar manner. The balance of the high-performance system remains the same. As reviewed previously, a spray distribution system is considered essential for the high-performance biofiltration concept. Any type of spray head design incorporated into an array that provides fairly uniform distribution over the filter bed is acceptable. To minimize maintenance liabilities, a head design with a large water passage should be used. One effective device is a shallow angled slot cut in a piece of PVC pipe. A manufactured spray head that is used in many designs is available from Bete Fog Nozzle, Inc. Both of these head designs have been observed to be practically clog-proof, given the level of pre-treatment of filter bed influent specified by the high-performance biofiltration concept. It has been observed that spray distribution will cause the surface of the bed to “dune” if it is not protected. This is a hazard to optimizing uniform distribution. It is recommended that some form of erosion control mat be placed over the bed surface to prevent undulations from forming. This mat must be a durable (non-biodegradable) material that will not clog. An erosion control revetment mat called Enkamat has been found to be a very effective material for this purpose. The filter media overlies an underdrain layer, as Figure 8 illustrates. The purpose of the underdrain is to promote free drainage of the media and to efficiently route effluent to the drain pipe. Typically, the underdrain is a large gravel. A nominal 3/4” -- 1-1/2” (1.9-3.8 cm) size is typically specified. The underdrain collection pipe is slotted to intercept effluent flow. A vent stack riser runs from its upstream end to the top of the filter bed to promote free flow of air through the underdrain. Note that the vent riser extends well above the media surface. This is to allow the filter to be flooded for the cleaning procedure, described in the next section. A barrier is placed on top of the underdrain to prevent media from intruding into the relatively large voids of the underdrain rock, and to prevent mixing of media with the underdrain during the bed cleaning procedure. This barrier must be a durable material that will not clog. Again, Enkamat has been found to be very efficient and effective for this purpose. SYSTEM OPERATIONS AND MAINTENANCEOperations and maintenance procedures for the high-performance biofiltration system include routine surveillance, pretreatment system maintenance, filter bed maintenance, and repairing or replacing failed components. These procedures are briefly reviewed here. All system functions should be checked periodically to verify that everything is working as required and to determine the need for executing the various maintenance procedures. This includes checking the dosing cycle of the filter bed dosing pump, verifying that alarms work as required, and observing the condition of the filter bed. Suggested frequency of these observations will vary with the size of the system, and in response to regulatory requirements. Generally, any significant operating problem that may affect treatment performance will be visually evident. However, if the regulatory agency having jurisdiction over the system feels that a direct check on effluent quality is also needed periodically, it is suggested that this could be executed very expeditiously by taking a reading of filter bed effluent turbidity. It has been observed that, in biofiltration system effluent, turbidity correlates very well with TSS, which correlates very well with BOD5. (Venhuizen, 1994) Turbidity can be easily checked in the field with a portable turbidimeter. Checking filter bed dosing pump operation consists of observing whether the pump turns on and off when the timer “makes” and “breaks”. The high water alarm is checked by lifting it to observe if the alarm activates. The low-level switch can be checked by depressing it and observing if the alarm activates. The in-line filtration device should be cleaned on a regular basis, the required frequency being a matter of experience with the device in question. The GAG Sim/Tech filter unit illustrated in Figure 5 is available with a pressure switch which can set off an alarm if the filter unit becomes too highly clogged and the head loss through it increases beyond a preset limit. Experience to date indicates that clogging of that filter will be very infrequent. The condition of the filter bed is checked visually. Each of the spray heads is checked for clogging while a dose is in progress. If the spray pattern is abnormal, the head should be cleaned. The required procedure would vary with the type of head used. The Bete Fog Nozzle head noted previously is a threaded fixture, so it can be unscrewed, cleaned out, and screwed back into its fitting. If any water is ponded on the bed filter bed at the time of the observation, or if water remains ponded on the surface for more than a half minute or so after the dosing pump shuts off, this indicates that the bed is clogging to the point where maintenance is needed. The pretreatment unit must be cleaned to remove primary sludge at various intervals. The frequency at which this cleaning is required will depend on the device, how it was sized, and the nature of the wastewater flow. Based upon a model suggested by Bounds (1994), the “oversized” septic tanks suggested in the Wisconsin standards (State of Wisconsin, 1999) should not need cleaning for seven years or more in systems receiving typical domestic wastewater. Recommended practice for septic tanks is to check sludge depth annually, when the effluent filter is cleaned, and pump when needed. Manufacturers of effluent filters typically recommend that they be washed off once every 2-3 years. However, the procedure is so easy to do that annual cleaning is suggested as a preventative maintenance procedure. The filter body is pulled out of the housing, hosed off, and then reinserted into the housing. Because wastewater contains some solids that will not readily biodegrade, eventually the filter bed will clog. With the high level of pre-filtration employed in the high-performance biofiltration concept, this is not expected to become an operational problem for several years, but overloading, system malfunctions, or negligent maintenance can lead to premature clogging. Whenever it occurs, filter bed maintenance is accomplished by an in situ “washing” procedure. The procedure consists of plugging the filter bed drain line and flooding the filter bed, then “agitating” the bed with an air compressor. A pipe is attached to the compressor hose. The pipe is repeatedly inserted into the filter bed. This agitation floats the biological solids out of the bed, as the media particles will settle immediately while the biological solids will remain suspended longer. While the bed is being agitated, the water on top of it is sucked off with a pumper truck hose, carrying these solids away with it. This is continued until the water level is lowered to the bed surface, then the procedure is repeated. Experience with this procedure indicates that about five iterations will thoroughly clean the filter bed. Because the majority of the clogging is likely to be in the upper portion of the filter bed, it is prudent to mark the compressor pipe so that only the top portion of the bed is agitated on the first pass or two, with progressively deeper probing in later iterations of the procedure. The only other maintenance that the treatment system may require is repair or replacement of pumps, valves, controllers or alarms if they fail to function properly. Design details should assure that these procedures can be accomplished expeditiously. Since continuous pump service is imperative for proper system performance, a failed pump is usually replaced. Whether other parts are replaced or repaired would depend upon their cost, complexity, serviceability and the capabilities of maintenance personnel. A VERSATILE TECHNOLOGYThe high-performance biofiltration concept is the culmination of more than 100 years of operating history and more than five decades of progressive development of improved design concepts. This versatile treatment concept provides highly reliable, high quality treatment while incurring minimal operations and maintenance liabilities. The concept can serve a single home or be scaled up to serve projects of considerable size—scale is simply a plumbing problem. As such, it is an excellent choice for a broad range of small-scale wastewater management projects where frequent oversight and sophisticated operating protocols are not available or affordable. Many conditions demand the use of such a high quality treatment system. These include areas with shallow groundwater, fractured bedrock—especially in aquifer recharge zones, where soils are problematic for dispersal of septic tank effluent, or anywhere that discharge must be well treated to avoid surface water pollution. REFERENCES1. Anderson, D. L., R. L. Siegrist, and R. J. Otis. 1985. Technology Assessment of Intermittent Sand Filters, U.S. EPA, Office of Research and Development, Municipal Environmental Research Laboratory, Cincinnati. 2. Bounds, T. R. 1994. Septic Tank Septage Pumping Intervals. On-Site Wastewater Treatment, Vol. 7, ASAE Pub. 18-94:58-65. 3. Calaway, W. T. 1957. Intermittent Sand Filters and their Biology. Sewage Works Journal, Vol. 29, No. 1:1-5. 4. Calaway, W. T., W. R. Carroll, and S. K. Long. 1952. Hetertrophic Bacteria Encountered in Intermittent Sand Filtration. Sewage and Industrial Wastes, Vol. 24, No. 5:642-653. 5. Clark, H. W. and S. Gage. 1909. A Review of Twenty-One Years of Experience Upon the Purification of Sewage at the Lawrence Experimental Station, Fortieth Annual Report of the State Board of Health of Massachusetts, Public Document No. 34. 6. Dymond, R. L. 1981. Design Considerations for Use of On-Site Sand Filters for Wastewater Treatment. M.S. Thesis, Institute for Research on Land and Water Resources, Pennsylvania State University. 7. Furman, T. deS., W. T. Calaway, and G. R. Grantham. 1955. Intermittent Sand Filters—Multiple Loadings. Sewage Works Journal, Vol. 21, No. 6:1002-1015. 8. Hagan, T. 2000. Personal communication. 9. Hines, M. H. and R. E. Favreau. 1975. Recirculating Sand Filters: An Alternative to Traditional Sewage Absorption Systems. Home Sewage Disposal, ASAE Pub. Proc-175:130-136. 10. Jowett, E. C. 1997. Sewage and Leachate Wastewater Treatment Using the Absorbent Waterloo Biofilter. Site Characterization and Design of On-Site Septic Systems, ASTM STP 1324:261-281. 11. Mitchell, D. T. 1986. Sand Filtration of Septic Tank Effluent. Small Flows, U.S. EPA National Small Flows Clearinghouse:2-3. 12. Mitchell, D. T. 1987. Personal communication. 13. Mitchell, D. T. 1991. Personal communication. 14. Montiel, A, B. Welte, and J. M. Barbier. 1988. Improvement of Slow Sand Filtration. Slow Sand Filtration, Ellis Horwood Ltd:47-59. 15. Piluk, R. J. 1988. Field Study of an Innovative On-Site Wastewater Disposal System for Nitrogen Reduction. M.S. Thesis, Graduate School of the University of Maryland. 16. Piluk, R. J. and E. C. Peters. 1994. Small Recirculating Sand Filters for Individual Homes. On-Site Wastewater Treatment, Vol. 7, ASAE Pub. 18-94:310-318. 17. Roy, C., R. Auger, and R. Chenier. 1998. Use of Non-Woven Fabric in Intermittent Filters. On-Site Wastewater Treatment, Vol. 8, ASAE Pub. 03-98:500-508. 18. Ruppe, L. 2000. Personal communication regarding research being conducted at the University of California at Davis. 19. Sandy, A. T. III. 1987. Nitrogen Removal Using a Batch Recirculating Bottom Ash Filter. Problem report submitted in partial fulfillment of requirements for M.S., College of Engineering, West Virginia University. 20. State of Wisconsin. 1999. Split Bed Recirculating Sand Filter System. Component Manual for Private Onsite Wastewater Treatment Systems. Department of Commerce, Division of Safety and Buildings. 21. Swanson, S. W. and S. P. Dix. 1987. Onsite Batch Recirculation Bottom Ash Filter Performance. On-Site Wastewater Treatment, Vol. 5, ASAE Pub. 10-87:132-141. 22. Tchbanoglous. G. 1999. Keynote address at 1999 NOWRA Conference, and subsequent personal communication. 23. Teske, M. G. 1979. Enhanced Treatment for Surface Discharge. Individual Onsite Wastewater Systems, Proc. of the Sixth National Conference:137-145. 24. U.S. EPA. 1980. Design Manual—Onsite Wastewater Treatment and Disposal Systems, EPA 625/1-80-012. 25. Venhuizen, D. 1994. Demonstration Systems Performance Analysis—Final Report. Town of Washington Wastewater Management Facility Plan. 26. Venhuizen, D., J. H. Wiersma, and J. A. Williams. 1998. Washington Island Project: Evolution of the Denitrifying Sand Filter Concept. On-Site Wastewater Treatment, Vol. 8, ASAE Pub. 03-98:470-479. |
||||||||||||||||||||||||||||